
Hard-rock conditions reproduced with 145 MPa UHPC cylinders, and what we measured when only the hammer change
At a glance
Purpose Compare drilling time of several DTH hammers under identical hard-rock conditions
Test specimens 7 UHPC (ultra-high-performance concrete) cylinders — compressive strength 144–146 MPa (avg. 145 MPa), SGS test report
Moulds Rolled steel pipe Ø1,200 mm × 12 mm wall × 1,500 mm high, buried in the test yard
Hammers compared TG450C (new, hard-rock) vs TG450S / TG550CS (2024 hard-rock design) vs TG550C (previous design)
Bit Ø555 mm
Air One compressor, set to 20 bar · 1,500 cfm (separate runs at 900 cfm)
Measured Drilling time (sec/m), blows per minute, piston stroke, compressor and rig working pressure, full video and audio recording
Result The new hard-rock models were consistently faster than the previous models in the same series (31–40 % less drilling time on the recorded figures)
Limitation Some cylinders cracked during drilling → absolute drilling times are indicative only; the ranking between models holds
Where and when Mokgam test yard, Siheung, Korea · 4 June 2024
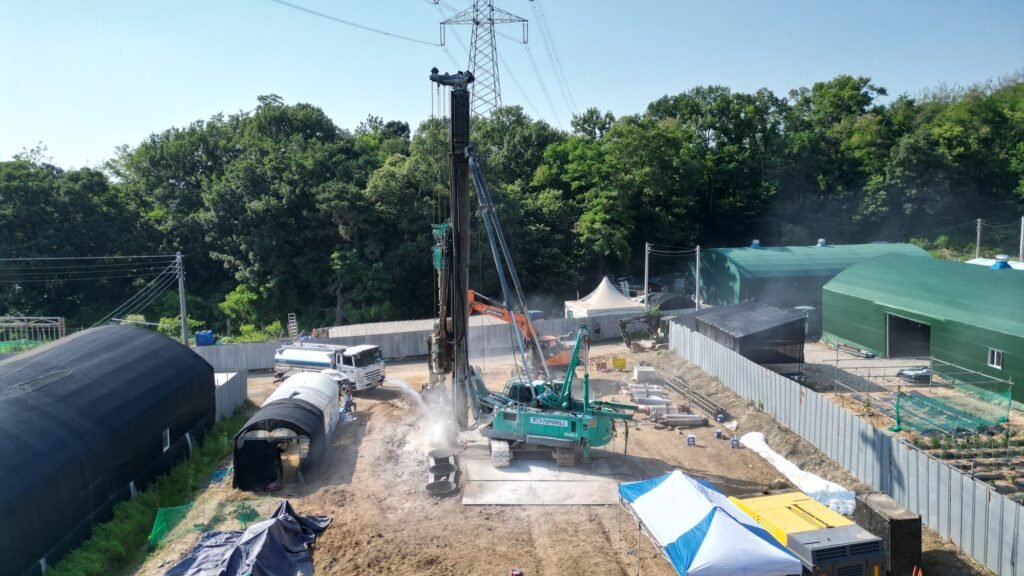
Photo 1 — If the rock is not uniform, the data cannot be. So we made the rock.
1. The limit of field data — “hard rock” is not one thing
The number that comes up most often when people talk about DTH hammer performance is penetration rate. Almost always it comes from a site record. The problem is that a site record does not show hammer performance alone.
Our own field data makes the point. Even within one 12 m hole drilled with the same rig and the same compressor, the log shows fill, soft rock and hard rock at different depths, and pressure and interval time change from layer to layer. Put hammer A and hammer B into different holes on different days and there is no way to tell whether the difference came from the hammer or from the rock.
The rock itself varies widely. In the Korean rock classification, hard rock spans a uniaxial compressive strength of 1,300–1,600 kgf/cm² (127.5–156.9 MPa). Within the single word “hard rock” the strength differs by about 23 %. Drilling 10,000 m of 127.5 MPa rock and drilling 10,000 m of 156.9 MPa rock are two very different numbers on a cost sheet — and that gap turns into change orders and site disputes.
So we started by taking rock chips from the field, preparing thin sections and examining the texture under a polarising microscope. Granite, quartz wacke — different mineralogy and grain structure respond differently to hammer impact even at the same compressive strength. That analysis continues, but one thing became clear: to compare hammers fairly, the variation in the rock has to be removed first.
2. So we made the hard rock — 145 MPa UHPC
There is only one way to remove the variation in natural rock: make an artificial rock whose strength we set ourselves.
The material we chose is UHPC (ultra-high-performance concrete). Ordinary structural concrete is 24–30 MPa; this is roughly five times that. We placed the target strength in the middle of the hard-rock band (127.5–156.9 MPa). Mix design, casting and curing were carried out with a Korean UHPC specialist.
The specimens were cast in rolled steel pipe moulds, Ø1,200 mm × 12 mm wall × 1,500 mm high. The base is a 12 mm plate (Ø1,197 mm) raised 20 mm and fillet-welded (C10). The diameter leaves enough confining wall around a Ø555 mm bit, and the 1.5 m height gives a measurable interval after the hammer settles into a steady impact cycle.
On 29 April 2024 the UHPC was cast into the moulds and vibrated to remove entrapped air. Each mould was labelled “TOPDRILL No. 1–7”, and 50 mm cube specimens were taken from the same batch.
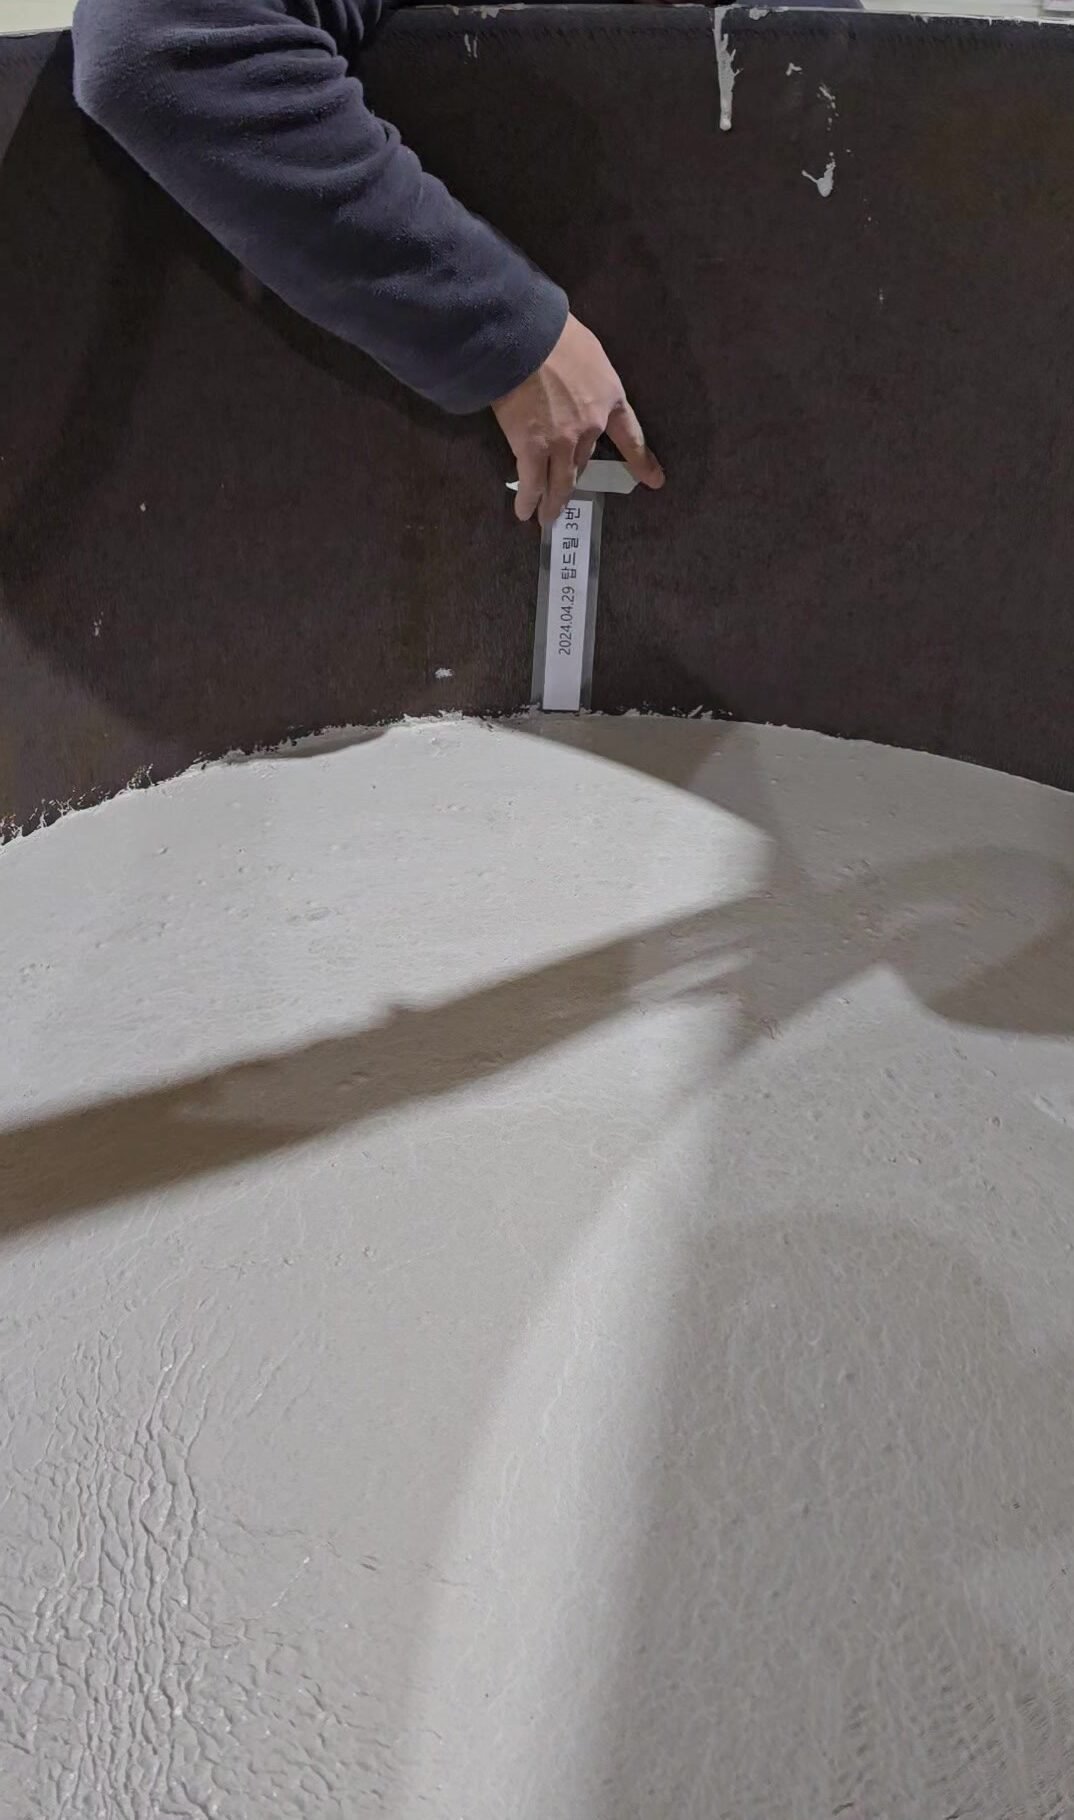
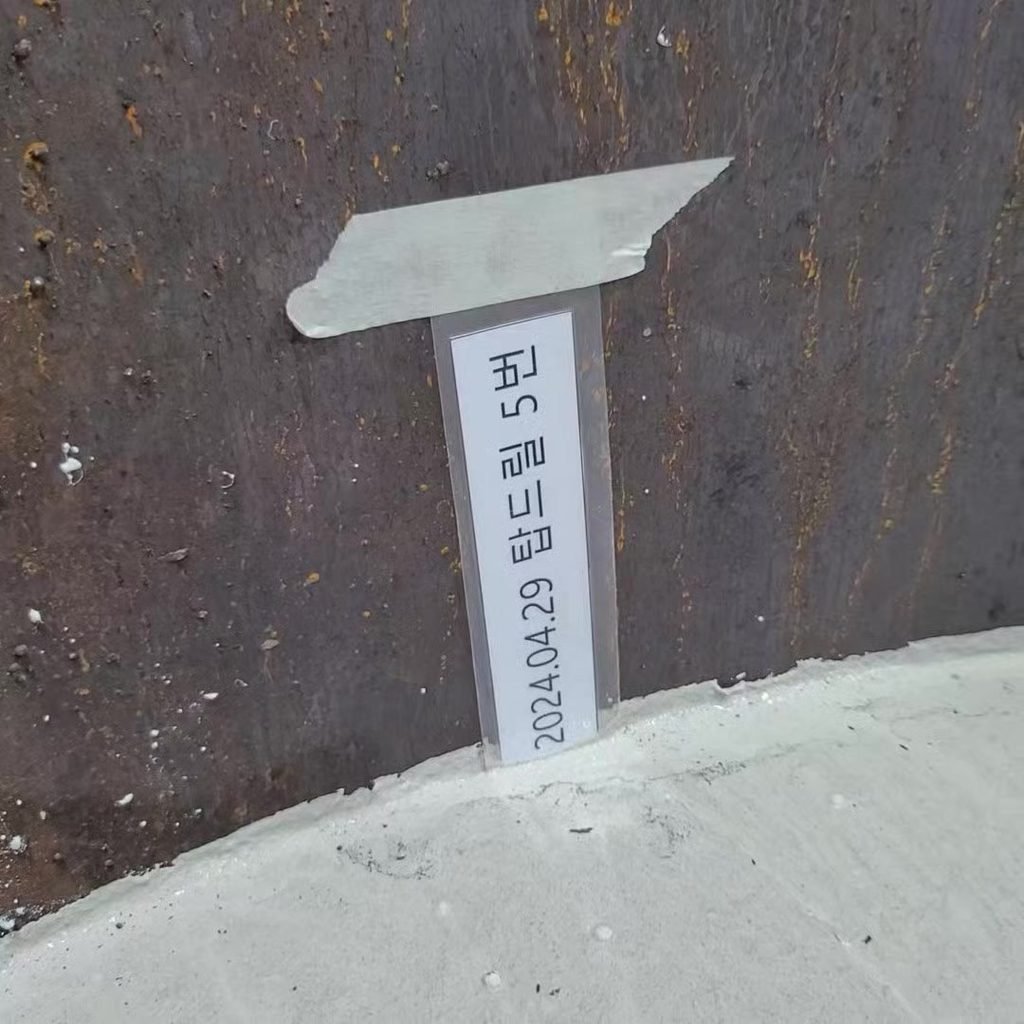
Photo 9 — Casting UHPC into a Ø1,200 mm steel mould. · Photo 10 — Right after casting: “2024.04.29 TOPDRILL No. 5”.
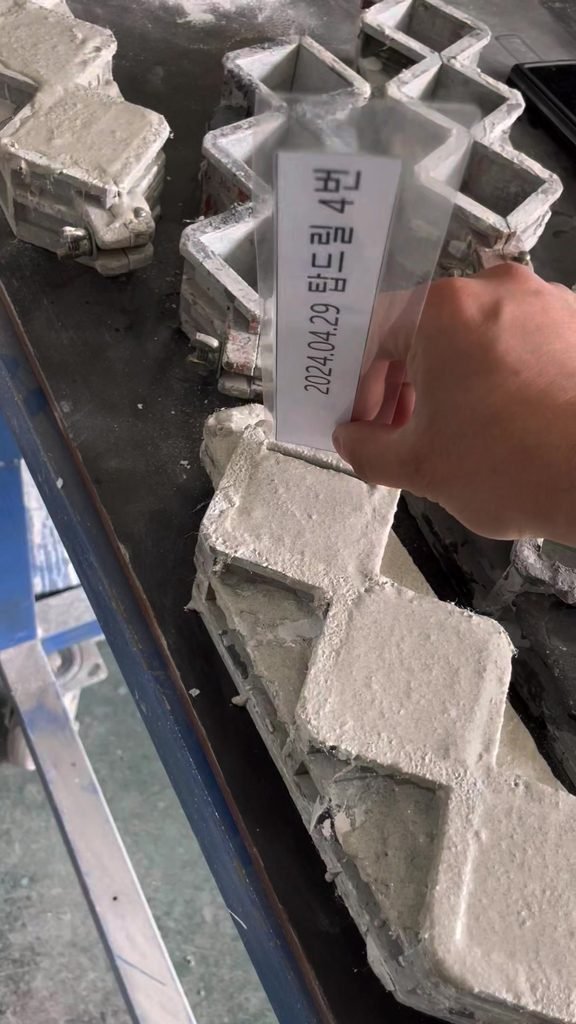
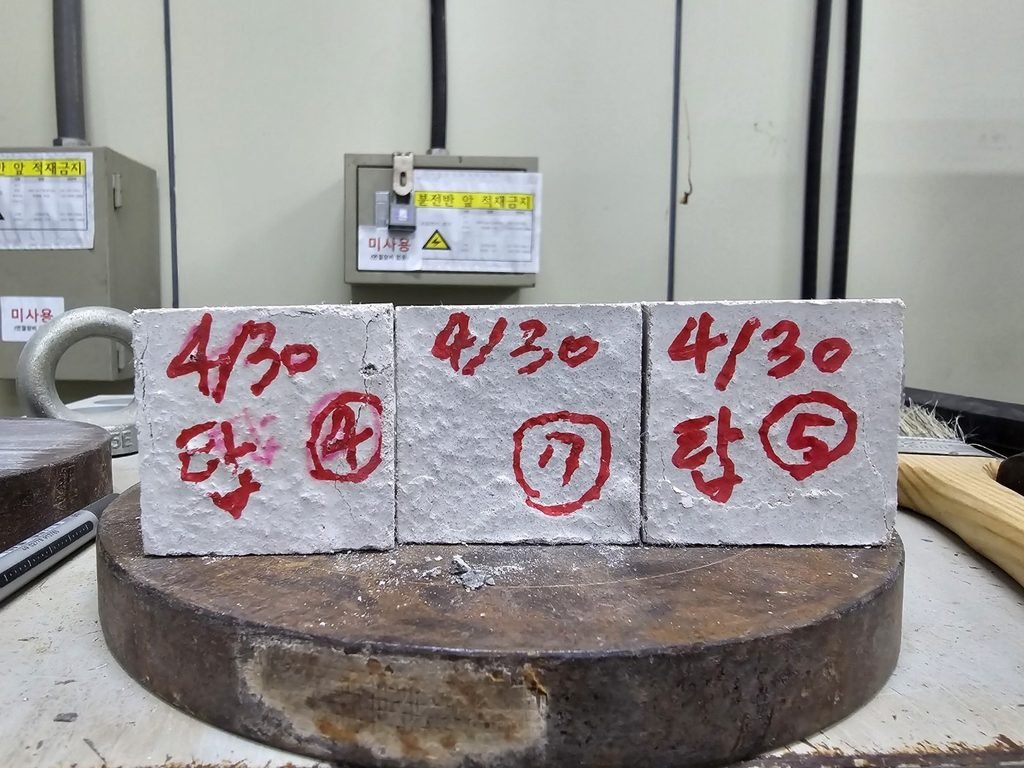
Photo 11 — 50 mm cube specimens from the same batch. · Photo 12 — Specimens before compressive testing, marked 4/30.
The cubes went to SGS Korea’s Construction Materials Testing Center for compressive-strength testing to KS L 5105:2022 (applied). Test period 29 May – 4 June 2024, report no. G-24-3350-R0. Results for six specimens: 144, 146, 144, 145, 146, 145 MPa — average 145 MPa. A spread of 2 MPa. No natural hard rock is that uniform.
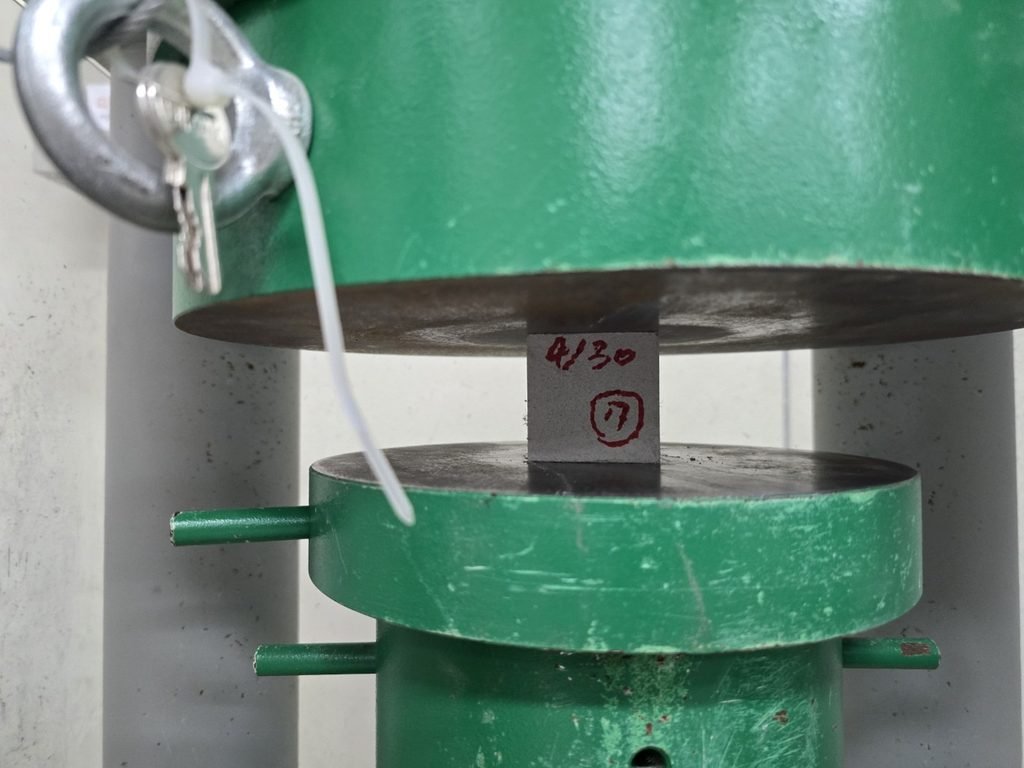
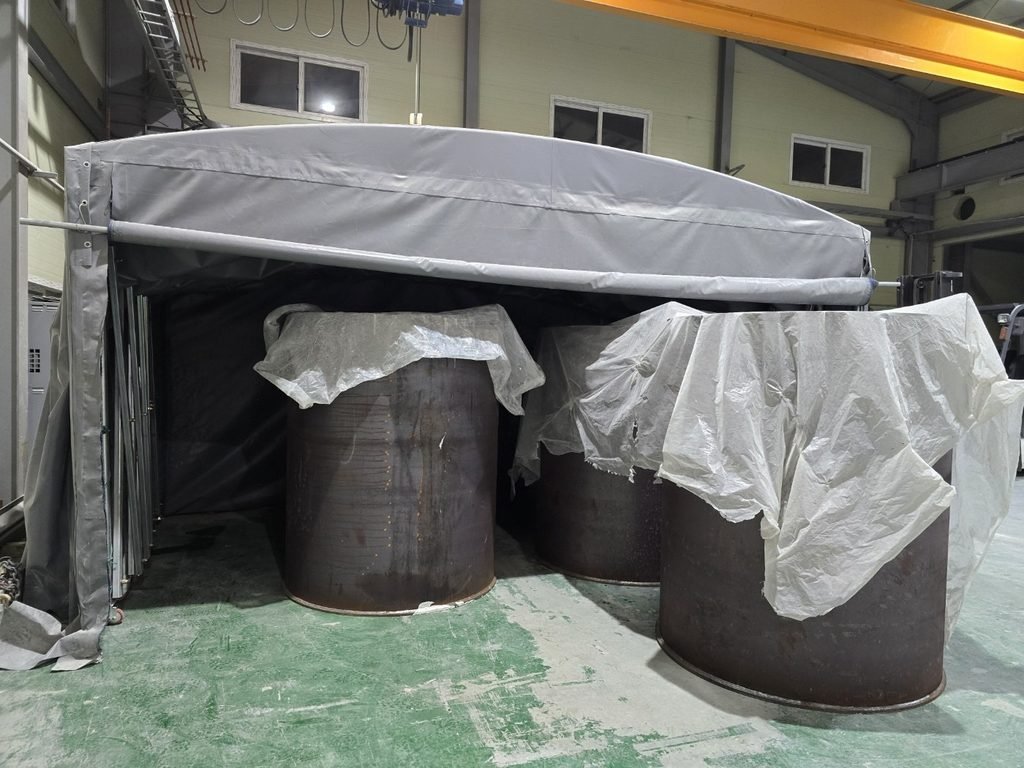
Photo 13 — 50 mm specimen in the compression testing machine. · Photo 14 — Cylinders curing at the plant.
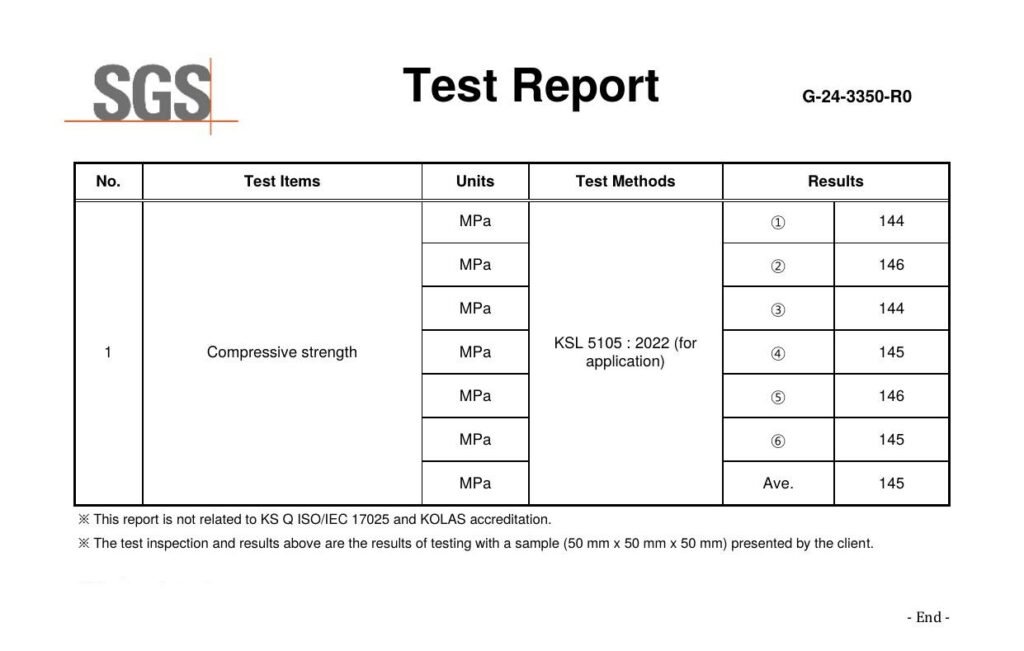
Photo 15 — SGS test report G-24-3350-R0, results page. All six specimens 144–146 MPa.
3. Preparing the test yard — why the cylinders were buried
You could stand a cylinder on the ground and drill it. But two things would then differ from a real site. First, the specimen would move and vibrate under the impact reaction. Second, real rock is confined on all sides; a free-standing cylinder is not.
So at the Mokgam test yard we cut a trench with an excavator, set the seven steel moulds in a row, and backfilled. The tops were set flush with the ground. From the rig’s point of view it is simply flat ground with seven hard-rock holes waiting in it.
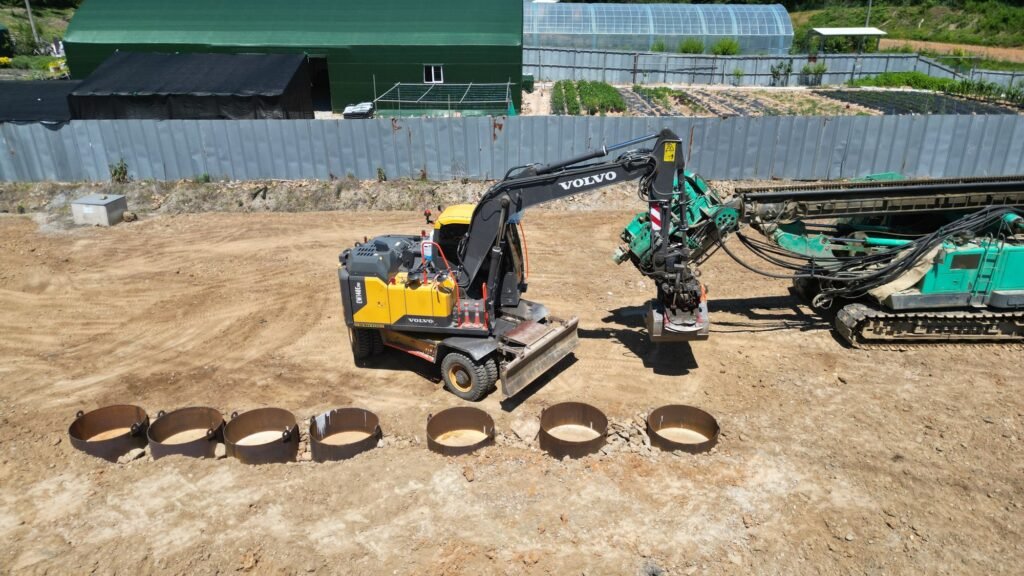
Photo 2 — Before burial: placing a steel mould in the trench.
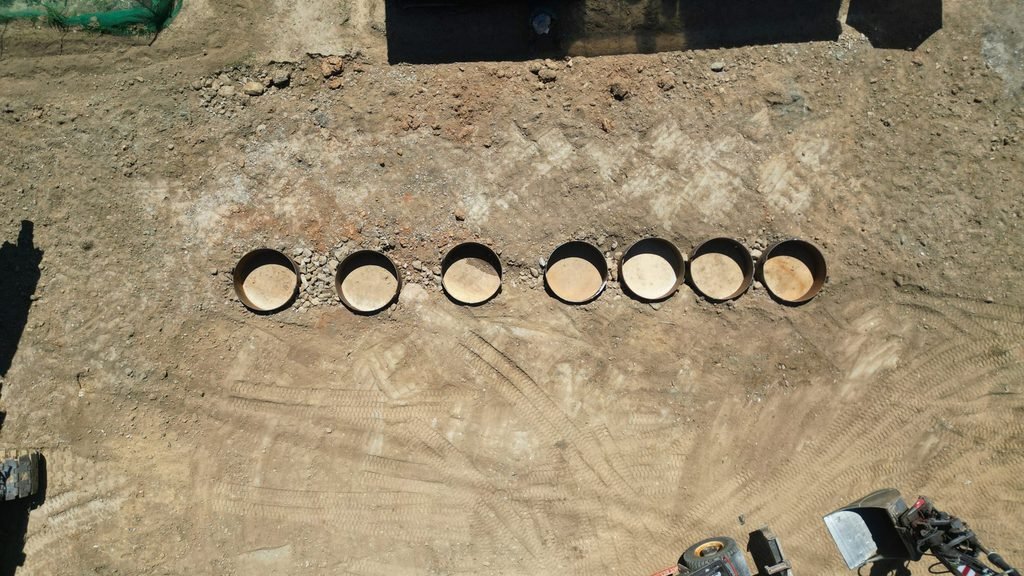
Photo 3 — Buried: seven cylinders with their tops flush with the ground.
4. Test set-up
Rig TOPDRILL crawler drill rig
Air One compressor, set to 20 bar · 1,500 cfm (some hammers also run at 900 cfm)
Bit Ø555 mm
Measured Drilling time (sec/m), blows per minute, piston stroke, compressor working pressure, rig working pressure, continuous video and audio
Before drilling, each hammer was run on a rubber-and-steel plate at 900 cfm and at 1,500 cfm to record piston stroke and blow rate first — so that the hammer’s response to air volume could be seen separately from the drilling result.
Seven hammers of the TG450 and TG550 series went to the yard that day, and competitors’ hammers were run on the same rig, the same compressor and the same specimens. This post reports the four models that allow a direct comparison between the new hard-rock design and the previous model. Competitors’ figures and model names are not published.
| Series | New hard-rock model | Previous model |
| TG450 | TG450C (new) | TG450S |
| TG550 | TG550C (new) | TG550C (previous) |
The new hard-rock models use a feed-tube type air distribution. Instead of routing air through passages in the hammer body to the chambers (air-distributor type), a feed tube delivers air directly to each chamber, cutting pressure loss and increasing the effective piston area. The result is higher impact energy and better cooling and lubrication, at the cost of tighter machining and a higher build cost. It is a design aimed at very hard rock, and this test was where that design had to prove itself in numbers.
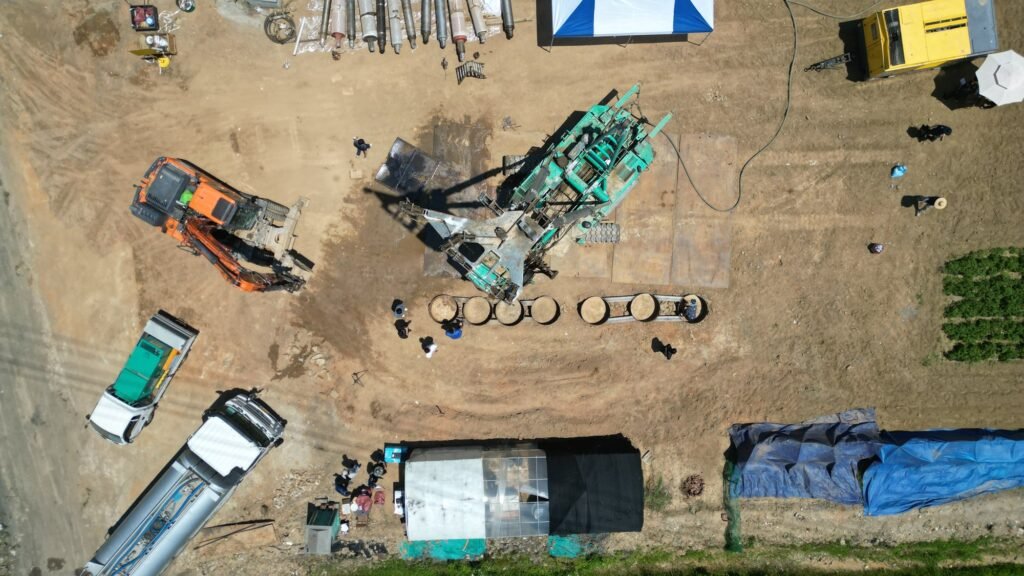
Photo 4 — The set-up: hammers under test lined up behind the rig, seven cylinders buried in front.
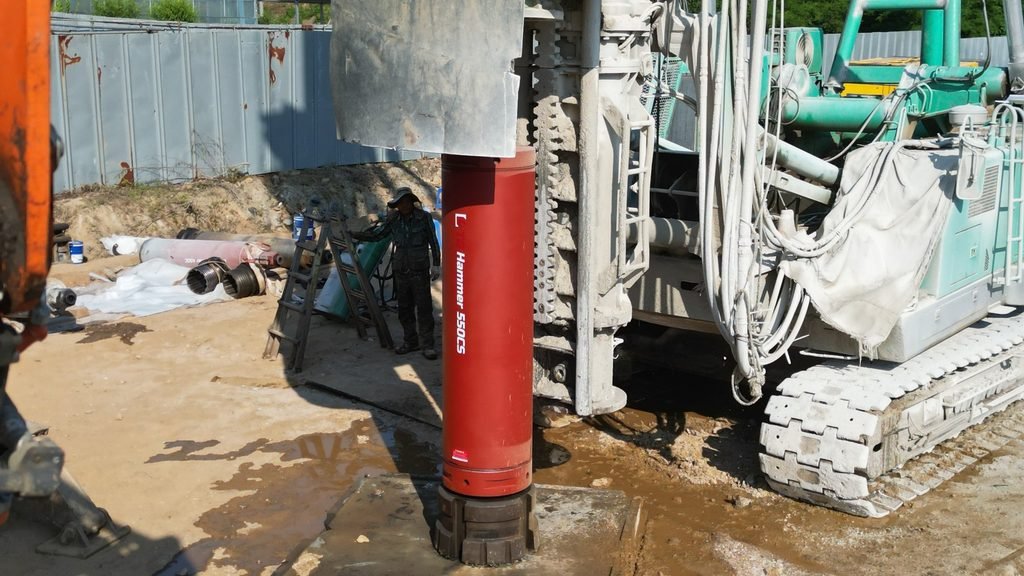
Photo 5 — A TG550-series hammer on the rig. In this test the hammer was the only variable.
5. Results — and what happened during the test
The table first. But read the two paragraphs after it before you read the numbers.
| TG450C (new, hard-rock) | TG450S | TG550C (new, hard-rock) | TG550C (previous) | |
| Drilling time (sec/m) | 925 | 1,347 | 1,211 | 2,034 |
| Converted (min/m) | 15.4 | 22.5 | 20.2 | 33.9 |
| Blows per minute | 540 | 540 | 516 | 540 |
| Working pressure (bar) | 14.7 | 14.8 | 14.8 | 15 |
The test did not go entirely to plan. Some of the cylinders cracked during drilling. Although the UHPC specimens had very high and uniform compressive strength, their tensile and fracture behaviour differs from natural rock, and under repeated impact several specimens developed splitting cracks. After cracking, the penetration rate dropped noticeably — we believe fragments wedged between the bit and the hole wall and increased rotational resistance.
That is why the sec/m figures in the table cannot be trusted as absolute values. Post-cracking intervals are mixed in, and their effect differs from cylinder to cylinder. We publish the table anyway — not to claim the numbers, but to show the readings from identical conditions exactly as they were recorded.
What survives, then, is the trend. Overlaying the pre- and post-cracking intervals with the separate runs, the ranking never changed. The new hard-rock model was faster than the previous model in its series in every interval, and the size of the gap pointed the same way as the 31–40 % in the table. Given that blow rate (516–540 BPM) and working pressure (14.7–15 bar) were nearly identical across all four hammers, the results are consistent with a higher effective impact energy per blow — which is the primary design target of the feed-tube system.
Competitors’ hammers were run under the same conditions. With the limitations above, this is not a precise numerical comparison — but seeing how competitors’ hammers perform on the same rig, the same air and the same specimen is information no catalogue comparison can give. Those results are not published here.
On the development target of “a hammer that drills hard rock at least 20 % faster”, the accurate statement is that the direction was confirmed under controlled conditions. To say it was exceeded, we need one more measurement on specimens that do not crack. That is the next test.
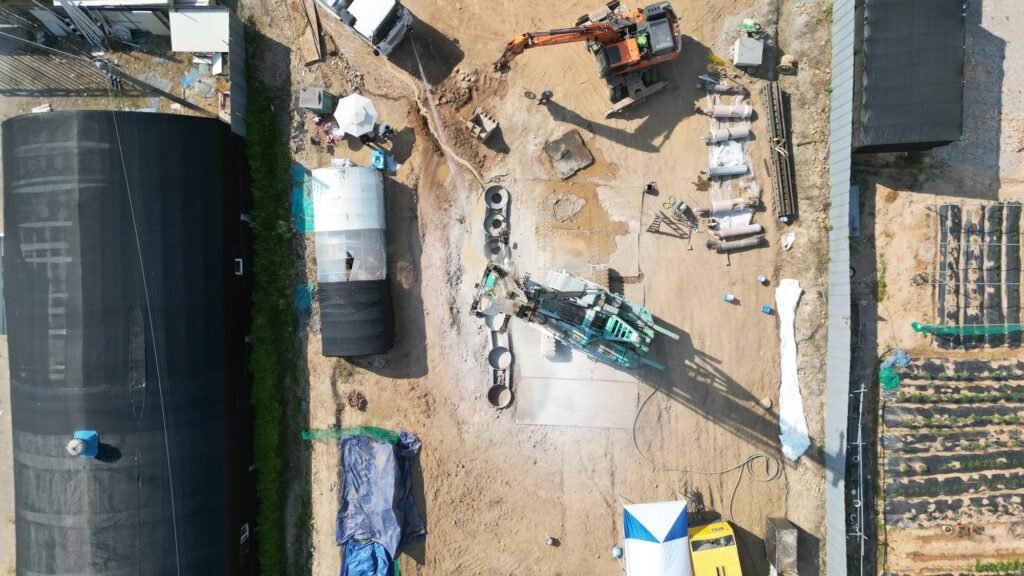
Photo 6 — The cylinders after drilling. Same strength, same air, same bit — only the hammer was different.
6. How to read these numbers
Do not carry the sec/m in this table straight to a site penetration rate. Four reasons.
First, some specimens cracked. As described above, post-cracking intervals were slowed by wedged fragments, and those intervals are in the readings. Read the ranking and the direction of the gap, not the absolute value.
Second, 145 MPa UHPC breaks differently from real hard rock. Natural rock fails along joints and fissures; UHPC is a homogeneous material with almost no internal defects. While it is intact there is no weakness for the hammer to exploit — a “harder” condition than natural hard rock — and once it cracks it behaves unlike rock again. Improving the specimen design is the task for the next test.
Third, the hammer working pressure was 14.7–15 bar. The compressor was set to 20 bar, but the pressure recorded at the hammer was lower. This is not a quirk of this test; it happens on every site. Even with 25 bar supply, piping losses, leakage at joints and back-pressure together commonly pull the working pressure at the hammer down to 12–18 bar. And at the moment of impact the pressure energy delivered by the compressor is converted into the kinetic energy of the piston, so a pressure drop during operation is physically unavoidable. The rated pressure in a catalogue and the actual pressure at the hammer inlet are different numbers, and the second one is what matters on site. Because the penetration rate of a large-diameter DTH hammer depends heavily on that working pressure, absolute rates at higher pressure will be faster than this table. All four hammers ran at the same pressure, so the relative comparison stands.
Fourth, this test was about comparison, not absolute speed. What we obtained is the relative position of our hammers — and of competitors’ hammers — in a uniform hard-rock-grade material. That baseline is what allows the next steps: a specimen design that does not crack, specimens at soft-rock and weathered-rock strengths, and defining the optimum impact energy, rotation torque and feed force for each rock class.
7. Why this test connects to cost estimating
The cost of rock drilling is ultimately decided in days. Rig hire, compressor hire and fuel, crane, excavator, crew — costs that accrue by the day, multiplied by the number of drilling days.
Until now the basis for predicting those days has mostly been the driller’s experience and say-so. Put an under-powered hammer into the same hard rock and the schedule stretches unpredictably; over- or under-priced bids turn into disputes between contractor and subcontractor, because there is nothing to judge by.
With drilling time measured by compressive strength, that judgement gets a basis. Knowing the rock class and compressive strength from the borehole log, you can estimate drilling time and specify the hammer and the rig parameters to match. This test is the first data point.
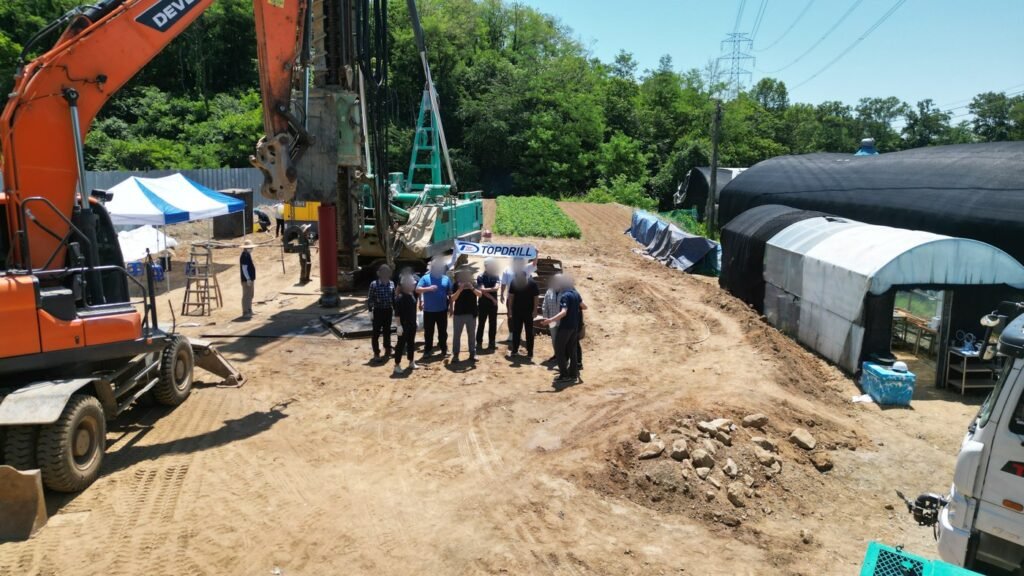
Photo 7 — The Mokgam test team: engineering, sales, production and quality in one yard.
Frequently asked questions
Why not test in real rock? Real rock varies by more than 20 % in compressive strength within a single class, and changes with depth inside one hole. To see the difference between hammer A and hammer B the rock has to be the same, and natural rock cannot give you that. UHPC cylinders at 145 MPa ±1 MPa were the way to create that condition.
Can UHPC stand in for real hard rock? By compressive strength it sits in the middle of the hard-rock band (127.5–156.9 MPa). But it has no joints or fissures, so it offers the hammer no weakness that natural rock would. It is suitable for relative comparison; absolute penetration rates must be verified separately on site.
Why were the cylinders buried? A free-standing cylinder moves under the impact reaction and, without confinement, fractures differently from rock. Buried, it presents the rig with the same situation as hard rock under flat ground.
What is the difference between a hard-rock hammer and a standard hammer? The new hard-rock models in this test use a feed-tube type air distribution: air goes straight to each chamber through a feed tube, reducing pressure loss and increasing the effective piston area, aiming at higher effective impact energy per blow at the same BPM and working pressure. In this test the new models recorded 31–40 % less drilling time, which is consistent with that design target.
The compressor was set to 20 bar — why was the working pressure 15 bar? This is normal on any site. Even with a 25 bar supply, piping losses, leakage at joints and back-pressure commonly pull the working pressure at the hammer down to 12–18 bar, and at the moment of impact pressure energy is converted into piston kinetic energy, causing a further drop. The 14.7–15 bar recorded here is the result. All four hammers ran under the same conditions, so the comparison is unaffected; absolute rates at higher pressure will be faster.
The specimens cracked — can the results be trusted? The absolute drilling times cannot, which is why this post does not present sec/m as a performance figure. But the ranking between models never changed across pre- and post-cracking intervals and repeated runs, and the differences came under identical BPM and pressure, so we consider the trend — the new hard-rock models are faster than the previous models — valid. Absolute values will be re-measured on specimens that do not crack.
Did you compare against competitors’ hammers? Yes — competitors’ hammers were run on the same rig, the same compressor and the same specimens. Because of the limitations above it is not a precise numerical comparison, but their performance level under identical conditions was observed directly. Figures and model names are not published.
What is the next test? First, change the specimen design (diameter, confinement) so that the cylinders can be drilled through without cracking, and re-measure absolute values. Then build specimens at other compressive strengths — soft rock, weathered rock — to measure drilling time by rock class, and compare other manufacturers’ hammers under the same conditions. The end goal is to define the optimum impact energy, rotation torque and feed force for each rock class so that drilling schedules and costs can be estimated from data.
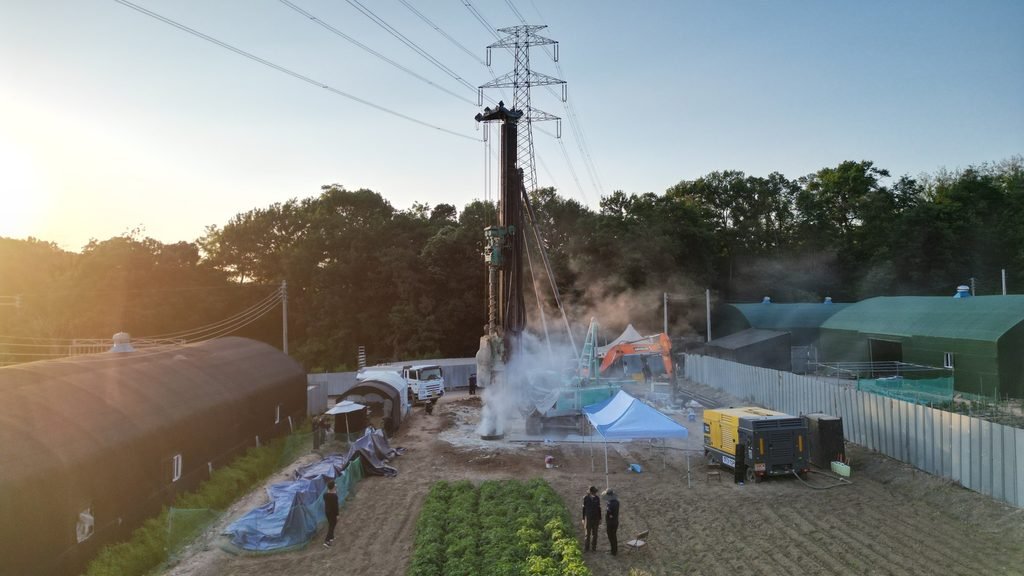
| Photo 8 — The test ran into the evening. Seven hammers, seven cylinders, one day. |
Closing
TOPDRILL has manufactured large-diameter DTH hammers and DTH bits in Korea since 1999 and supplies them to about 100 countries. To talk in numbers measured under identical conditions rather than catalogue figures, we built the hard rock ourselves and drilled it. The test did not go entirely to plan, so this post reports the part that did not work as plainly as the part that did. The next test starts by fixing it.
If you are ahead of a rock-drilling schedule estimate or a hammer selection, send us the borehole log, the compressive-strength test results and the compressor specification available on site. Using this test as a baseline, we will reply with an expected drilling time and a suitable hammer.
Request a quote →https://topdrill.org/contact/ More field references →https://topdrill.org/category/references